A Level outcomes
2023 A Level outcomes
This was the second set of examinations following the COVID-19 pandemic, and the first which could be described as 'normal'.
However, the circumstances faced by Year 13 students were definitely not normal. In addition to the disruption to their school caused by the pandemic lockdowns, they had not had the experience of sitting GCSEs due to the cancellation of the 2021 examinations and their replacement by 'Teacher Assessed Grades' based on a range of internal assessment taken over time.
We were therefore very pleased that the grades awarded to Year 13 students were as follows:
|
Key indicator |
2023 results |
| % A* grades | 20.6% |
| % A/A* grades | 53.0% |
| % A*-B grades | 76.4% |
| % A*-C grades | 89.8% |
At national level, the proportion of students achieving top A level grades fell sharply this year because the grading system has been adjusted so that the distribution of grades in England is similar to that in 2019. This adjustment is a return to normality after the pandemic which necessitated the use of different approaches to grading in 2020, 2021 and 2022.
The table below shows the outcomes for Langley Grammar School under these different processes across 2018 to 2023.
|
Outcomes measure |
2018 Normal exams |
2019 Normal exams
|
2020 Centre assessed grades (CAGs) |
2021 Teacher assessed grades (TAGs) |
2022 Modified examinations |
2023 Normal exams
|
|---|---|---|---|---|---|---|
|
A*-E grades |
99.1% |
99.4% |
100.0% |
100.0% |
99.4% |
98.6% |
|
A*-C grades |
89.5% |
87.5% |
96.2% |
92.1% |
94.0% |
89.8% |
|
A*-B grades |
71.2% |
67.3% |
81.3% |
79.4% |
85.4% |
76.4% |
|
A*/A grades |
35.6% |
36.7% |
57.4% |
57.6% |
71.7% |
53.0% |
|
A* grades |
9.8% |
8.5% |
20.1% |
23.7% |
34.6% |
20.6% |
2022 A Level outcomes
This was the first set of examinations following the COVID-19 pandemic, and Year 13 students had not had the experience of sitting their GCSEs due to the cancellation of the 2020 examinations.
The grades awarded to Year 13 students were as follows:
|
Key indicator |
2022 results |
| % A* grades | 34.6% |
| % A/A* grades | 71.7% |
| % A*-B grades | 85.4% |
| % A*-C grades | 94.0% |
Results for previous years are given below. Direct comparisons should be treated with caution because of the different methods of assessment and the national statistical manipulation to return the overall grade profile to 2019 levels over two years. However, was is very pleasing to see that the proportion of top grades achieved by LGS students increased against 2021 and very significantly against the 2019 examination-based results.
These excellent results enabled the great majority of students to take up their preferred university places or to pursue other paths such as higher level apprenticeships. They had shown enormous resilience and determination, and we wish them every success as they pursue their future studies, training and career choices.
2021 A Level outcomes
The 2021 A Level examinations were cancelled due to the coronavirus pandemic.
Year 13 students in 2021 received A Level grades based on Teacher Assessment Grades (TAGs) for each subject.
The TAGs we submitted were in line with our Centre Policy, which was approved by the exam boards. We also had to send a sample of our evidence and grading to the exam boards as part of quality assurance check.
The grades awarded to Year 13 students through this process were as follows:
|
Key indicator |
2021 final grades |
| % A/A* grades | 57.6% |
| % A*-B grades | 79.4% |
| % A*-C grades | 92.1% |
These outcomes have not been used by the Department for Education for accountability purposes and will not feature in the school performance tables.
2020 A Level outcomes
The 2020 A Level examinations were cancelled due to the coronavirus pandemic.
Students in 2020 received A Level grades which were the higher of their Centre Assessment Grade or the examination board's Calculated Grade for each subject. For an explanation of how these grades were awarded, please click here.
The grades awarded to Year 13 students through this process were as follows:
|
Key indicator |
2020 final grades |
| % A/A* grades | 57.4% |
| % A*-B grades | 81.3% |
| % A*-C grades | 96.2% |
These outcomes have not been used by the Department for Education for accountability purposes and will not feature in the school performance tables.
2019 A Level results
Across the country as the proportion of A and A* grades awarded fell to their lowest level since 2007, students at Langley Grammar School bucked the national trend and managed to achieve a higher proportion of the top grades than last year, maintaining the school's high standards and the reputation of its excellent Sixth Form.
A total of 153 students sat over 460 A Level examinations between them. Over 35% of exams taken resulted in grades A* or A and 66% of entries achieved grades A*-B, while the school's overall pass rate (A*-E grades) rose to 99.4% Twenty-six students (nearly a fifth of the year group) gained A* or A grades across all their subjects.
These excellent results enabled the great majority of students to take up their preferred university places or to pursue other paths such as higher level apprenticeships.
When the Department for Education releases validated post-16 performance data in January 2020, we will provide a link to the updated page on the Compare School Performance website.
DfE School Performance Information (A Levels)
Comparative information about progress in Slough schools can be found through the following link:
DfE Performance Tables - local area
What value do we add?
Gaining good grades at A Level is very important - the grades are the key to 'opening doors' in terms of accessing higher education courses. However, students completing A Level programmes have come from very different backgrounds in terms of their prior achievement at GCSE. Some students have almost all A* grades; others may have a consistent set of B grades across their subjects. What is important is the value we have added based on their starting points - how well have Langley Grammar School students done compared to others with similar academic backgrounds?
We measure the value added using a system called ALPS - A Level Performance System. Essentially this is a large database of A-Level results drawn from over 1500 schools and colleges and covering 75% of students taking A Levels. The ALPS system provides us with a number of indicators which can help us analyse how our students have performed.
Each ALPS indicator has a benchmark 'thermometer'. The thermometer is created by taking scores achieved by every school and college and ranking these from best (top) to worst (bottom). The numbers running down the centre of the thermometers show the ALPS grades running from 1 (best) to 9 (worst).
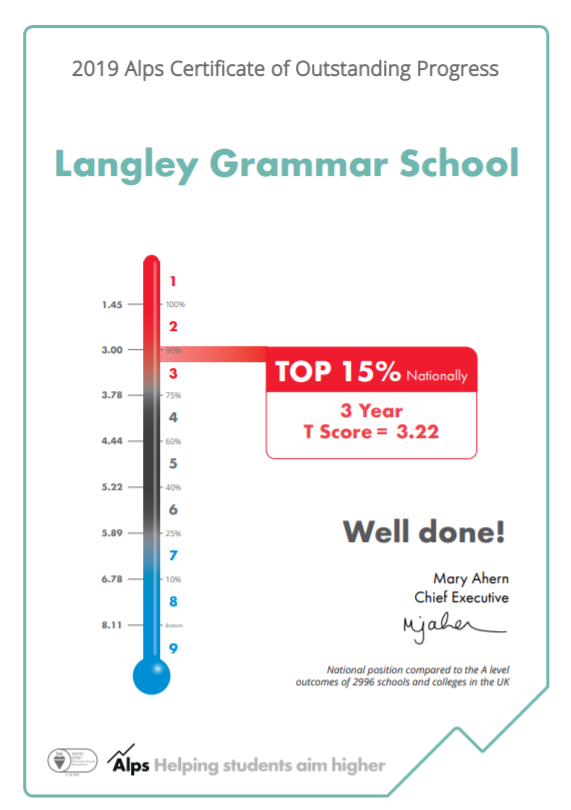 An overall ALPS 'T Score' of grade 5 means students do no better or worse than they would do in any other school - they perform 'as expected' for their ability. For many years we have consistently secured ALPS grade 2 or 3 'Excellent', scoring between the 75th and 89th percentile.
Over three years Langley Grammar School has therefore consistently performed in the top 15% of schools and colleges for value added, meaning that students perform significantly better than the average for their already high academic background. This doesn't just happen - it is the result of good teaching and excellent support for the students during their time in the Sixth Form.
Statutory information
The Department for Education requires us to publish particular information regarding A Level outcomes. Please read the explanatory notes carefully.
| Average grade achieved | DfE measure of progress made | Retention | Progress in English and Maths | Students continuing in education or training | |
| See Note 1 | See Note 2 | See Note 3 | See Note 4 | See Note 5 | |
| 2022 | A (48.4 pts) | Not published | 96.0% | Not published | Not published |
| 2021 | Not published | Not published | Not published | Not published | 95% (2019 cohort) |
| 2020 | Not published | Not published | Not published | Not published | Not published |
| 2019 | B (38.8 pts) | +0.04 | 96.8% | None eligible | 92% (2017 cohort) |
| 2018 | B (38.8 pts) | +0.09 | 96.2% | None eligible | 93% (2016 cohort) |
| 2017 | B (40.2 pts) | +0.13 | 98.2% | None eligible | 92% (2015 cohort) |
| 2016 | B (38.7 pts) | +0.07 | 99.5% | None eligible | 92% (2014 cohort) |
Note 1 - Average grade achieved
These figures tell you the average grade and average points that students achieved per A level entry. Each grade has a points value to all qualifications based on the following equivalence:
A* = 60, A = 50, B = 40, C = 30, D = 20, E = 10
The information provided here is taken from the DfE Performance tables.
Note 2 - Progress
This figure tells you how much progress students made between the end of Key Stage 4 (Year 11) and the end of their A level studies, compared to students across England who gained similar GCSE results.
The scores are calculated by comparing the A-level results of students at this school or college with the A level results of students in schools and colleges across England who started with similar GCSE results at the end of Year 11.
A score above zero means students made more progress, on average, than students across England who got similar results at the end of Year 11. Langley Grammar School's Sixth Form students have well above average GCSE profiles, and go on to achieve A-Level grades which are above the average for those of other students of similar ability.
Comparative information about progress in Slough schools can be found through the following link:
Note 3 - Retention
As the participation age has been increased to 18, it is increasingly important that all young people are given suitable education and training opportunities that they see through to completion. The retention measure shows the percentage of students who get to the end of the post-16 programme of study that they enrolled on. Almost all Langley Grammar school students complete their two-year A-Level programme; where there are occasional exceptions, these are inevitably due to particular special circumstances.
Note 4 - Progress in English and maths
We are required to publish the progress of students in English and maths where they did not achieve at least a grade 4 at GCSE by the end of Year 11. The admissions criteria for entry into Langley Grammar School's Sixth Form require students to have achieved a GCSE grade 5 in both English and maths; students will therefore only fall into this category in exceptional circumstances. In 2019, all students in Year 13 at Langley Grammar School had achieved grade 4 or above in both English and maths at the end of Year 11.
Note 5 - Students continuing in education and training
Destination measures show the percentage of Sixth Form students going to or remaining in an education and/or employment destination after they leave the school. The Department for Education tracks students after they leave school through a variety of different data sets, but it takes some time for this data to be collated.
The most recent data reports on students in the 2015/16 academic year and identifies their education and/or employment destinations between October 2016 and March 2017. To be included in the measure, young people had to complete the first two terms of the academic year at one or more education destinations, or be in employment for 5 of the 6 months.
The great majority of Langley Grammar school students go on to higher education courses as reputable universities. A small number move into direct employment or higher level apprenticeships. Some students will take a gap year in order to reapply to university, and may spend that year travelling or working overseas - such activity would not be included in the measure.