
GCSE outcomes
2023 GCSE outcomes
This was the second set of GCSE examinations following the COVID-19 pandemic, but the first which could be described as 'normal'.
However, the circumstances faced by Year 11 students were definitely not normal due to the disruption caused by the pandemic in those important foundation years of secondary school.
We were therefore very pleased that the grades awarded to Year 11 students were as follows:
| Key indicator | 2023 results |
| % 9 grades | 30.1% |
| % 9-8 grades | 56.3% |
| % 9-7 grades | 76.8% |
| % 9-5 grades | 97.6% |
At national level, the proportion of students achieving top grades fell this year because the grading system has been adjusted so that the distribution of grades in England is similar to that in 2019. This adjustment is a return to normality after the pandemic which necessitated the use of different approaches to grading in 2020, 2021 and 2022.
Against this national background of a return to the 2019 grade profile, the GCSE outcomes for LGS students are very encouraging – students generally did very well indeed. There were some remarkable individual performances with overall around 30% of outcomes awarded at Grade 9 and 77% grades 9-7.
The table below shows the outcomes for Langley Grammar School under these different processes across 2018 to 2023.
|
Measure |
2018 Normal exams |
2019 Normal exams
|
2020 Centre assessed grades (CAGs) |
2021 Teacher assessed grades (TAGs) |
2022 Modified examinations |
2023 Normal exams
|
|
Overall grades 9-5 |
96.4% |
93.5% |
97.7% |
97.7% |
99.2% |
97.6% |
|
Grades 9-7 |
71.6% |
64.2% |
79.2% |
77.7% |
84.7% |
76.8% |
|
Grades 9-8 |
50.6% |
38.3% |
52.9% |
52.0% |
70.4% |
56.3% |
|
Grade 9 |
25.2% |
15.4% |
24.7% |
23.1% |
45.1% |
30.1% |
|
Attainment 8 * |
76.6 |
73.4 |
77.4 |
76.0 |
81.4 |
78.2 |
* The Attainment 8 score is the average of the student's best 8 GCSE grades, with English and Maths double-weighted.
The Department for Education has published comparative data about all schools' outcomes at GCSE level, with advice to use this information cautiously because of the legacy impact of the pandemic.
For information about Langley Grammar School, please visit the DfE website.
The 2023 Compare school and college performance tables show the school's Progress 8 (P8) figure as 0.83.
This means that our students' GCSE outcomes were typically nearly one grade higher than the average obtained by students with similar ability across the country.
2022 GCSE outcomes
LGS students achieved a fantastic set of results in the 2022 GCSE examination series. This was particularly commendable as this was the first set of GCSE examinations following the pandemic, and Year 11 students experienced significant disruption during their GCSE courses. They worked hard to overcome the difficulties, with the excellent support and dedication of their teachers.
The grades awarded to Year 11 students were as follows:
| Key indicator | 2022 final results |
| % 9 grades | 45.1% |
| % 9-8 grades | 70.4% |
| % 9-7 grades | 84.7% |
| % 9-5 grades | 99.2% |
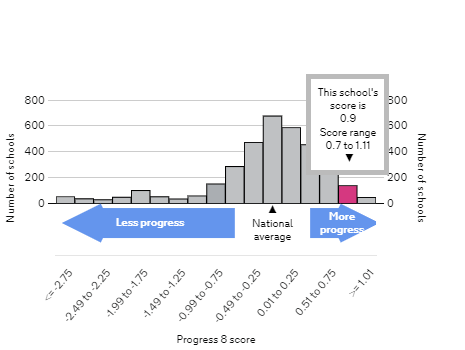
The 2022 Department for Education performance tables shows the school's Progress 8 (P8) figure as 0.9.
This means that our students' GCSE outcomes were typically almost a grade higher than the average obtained by students with similar ability in other schools.
GCSE outcomes for previous years are given below. Direct comparisons should be treated with caution because of the different methods of assessment and the national statistical manipulation. However, it is very pleasing to see that contrary to the national position, the proportion of top grades achieved by LGS students has increased against 2022 and also very significantly against the 2019 examination-based results.
2021 GCSE outcomes
The 2021 summer GCSE examinations were cancelled in January 2021 due to the coronavirus pandemic.
Students in 2021 received GCSE grades which were based on Teacher Assessed Grades (TAGs) for each subject. The TAGs were submitted in line with our Centre Policy, which was approved by the examination boards. We also had to send a sample of our evidence and grading to the exam boards as part of quality assurance check.
The grades awarded to Year 11 students through this process were as follows:
|
Key indicator |
2021 final grades |
| % 9 grades | 23.1% |
| % 9-8 grades | 52.0% |
| % 9-7 grades | 77.7% |
| % 9-5 grades | 97.7% |
These outcomes will not be used by the Department for Education for accountability purposes and will not feature in the school performance tables.
2020 GCSE outcomes
The 2020 GCSE examinations were cancelled due to the coronavirus pandemic.
Students in 2020 received GCSE grades which were the higher of their Centre Assessment Grade or the examination board's Calculated Grade for each subject. For an explanation of how these grades were awarded, please click here.
The grades awarded to Year 11 students through this process were as follows:
|
Key indicator |
2020 final grades |
| % 9 grades | 24.7% |
| % 9-8 grades | 52.9% |
| % 9-7 grades | 79.2% |
| % 9-5 grades | 97.7% |
These outcomes will not be used by the Department for Education for accountability purposes and will not feature in the school performance tables.
2019 GCSE results
Our Year 11 students sat 1700 GCSE examinations in May  and June 2019, and were eagerly awaiting the outcomes on Results Day on 22 August.
Just under two thirds of the grades awarded were Grade 7 or above - a tremendous achievement reflecting the students' hard work and commitment throughout their courses, and the dedication and support of the staff.
Nearly 40% of the grades awarded were Grade 8 or 9, equivalent to A* or above on the old grading system. In some subjects the proportion of Grade 9s achieved was high, and we must make special mention of Chemistry where 38% of the students achieved the highest grade.
83 students gained Grades 7, 8 or 9 in 8 or more of their subjects, and over 70% gained five or more grades at these levels.
Overall, 64% of the results were grades 9-7, A* or A
20% of entries across all the reformed subjects were awarded the highest grade 9
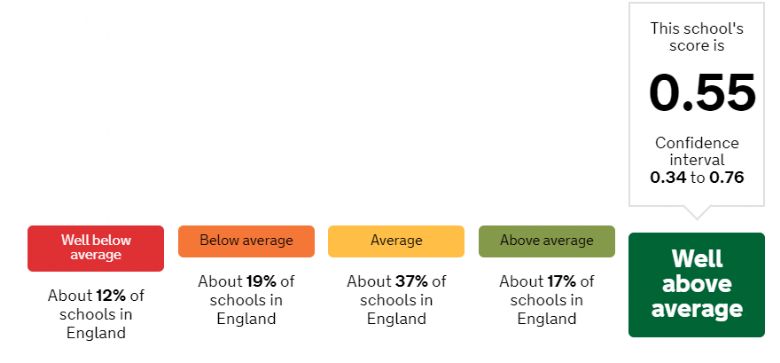
The Department for Education performance tables shows the provisional (unvalidated) P8 progress figure as 0.55
Langley Grammar School students have benefited from a broad and balanced education. They maintained their studies of a wide range of subjects including music, art, drama and technology until the end of Year 9 before being required to choose GCSE options. 78% of the year group went on to gain qualifications in the Government's EBacc group of core academic subjects which comprises English, Maths, Sciences, a modern foreign language and either History or Geography, and uptake to other subjects such as drama, music and art was strong.
GCSE outcomes over time
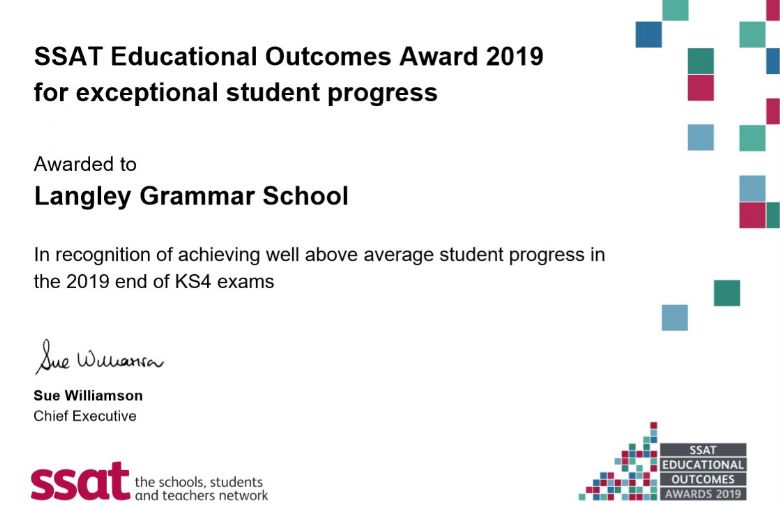
Langley Grammar School has been nationally recognised over the last four years for its exceptional performance by the national network SSAT. The annual educational Outcomes data analysis from SSAT has shown that the school has been consistently in the top 10% of schools nationally for the progress made by students during their GCSE courses.


Sue Williamson, Chief Executive of SSAT said:
“I am delighted that Langley Grammar School has won an Educational Outcomes Awards. This recognises one important aspect of the school’s work but at SSAT we believe an outstanding school has deep social justice at the heart of its plan; it subjects that plan to constant challenge and innovation; and it liberates teachers to perform brilliantly in the classroom. SSAT is pleased to recognise the quality of leadership and the hard work of all staff to ensure the success of every child. A big thank you and well done to students, parents, staff and governors.”
Statutory information about GCSE outcomes
The Department for Education requires us to publish particular information regarding GCSE outcomes.
Please read the explanatory notes carefully.
|
Progress 8 score |
Attainment 8 score |
Students achieving Grade 4 or above (formerly A*-C) in English and Maths |
Students achieving Grade 5 or above in English and Maths |
Students achieving the EBacc at Grade 4+/C+ |
Students continuing in education or training |
||
| See note 1 | See note 2 | See note 3 | See note 4 | See note 5 | See note 6 | ||
| 2023 | tbc | 78.2 | 99% | 98% | 72% | TBC | |
| 2022 | 0.91 | 81.4 | 100% | 100% | 77% | 100% | |
| 2021 | N/A | 76.0 | Not published | ||||
| 2020 | N/A | 77.4 | Not published | ||||
| 2019 | 0.55 | 73.3 | 99% | 97% | 78% | TBC | |
| 2018 | 0.97 | 76.6 | 99% | 99% | 69% | TBC | |
| 2017 | 0.66 | 71.9 | 100% | 97% | 71% | 97% | |
| 2016 | 0.35 | 69.8 | 99% | - | 71% | 99% | |
| 2015 | - | - | 99% | - | See notes | 99% | |
| 2014 | - | - | 100% | - | 51% | 100% | |
| 2013 | - | - | 100% | - | 55% | 100% | |
Explanatory notes:
Note 1 - Progress 8 score
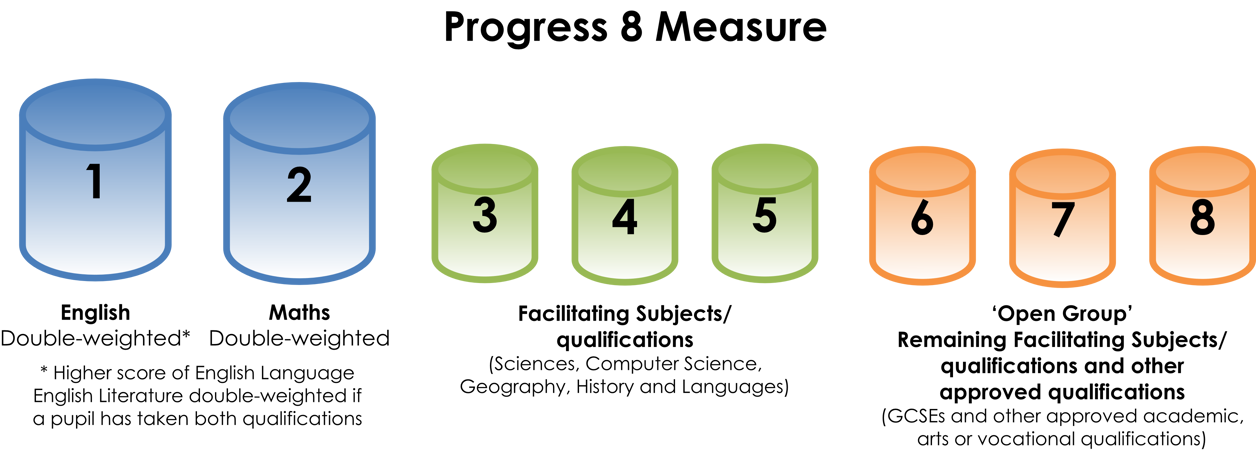
Progress 8 aims to capture the progress a pupil makes from the end of primary school to the end of secondary school. It is a type of value added measure, which means that pupils’ results are compared to the actual achievements of other pupils with the same prior attainment.
The score shows how much progress pupils made between the end of Key Stage 2 (Year 6) and the end of Year 11, compared to pupils in England who got similar results in the Key Stage 2 SATs assessments.
The Progress 8 score is based on up to 8 qualifications, which include English, maths, 3 'English Baccalaureate' qualifications including sciences, computer science, history, geography and languages, and 3 other additional approved qualifications. Maths and English are also double weighted compared to other subjects.
The average Progress 8 score for 'mainstream' schools in England is zero. Mainstream schools are schools that aren’t special schools or 'alternative provision settings' (for example pupil referral units). A score above zero means pupils made more progress, on average, than pupils across England who got similar results at the end of Key Stage 2.
Be aware that:
- No matter how high a pupil's KS2 outcomes, there is an upper to limit to the progress they can make - they cannot achieve higher than an A* grade, or a Grade 9 in the new reformed qualifications. This 'ceiling effect' may limit the Progress 8 score.
- Progress 8 scores also have an associated 'confidence interval' within which the score actually lies. Schools may have different Progress 8 scores but if the confidence intervals overlap, there is no statistically significant difference between them.
Note 2 - Attainment 8 score
Schools get a score based on how well pupils have performed in up to 8 qualifications, which include English, maths, 3 'English Baccalaureate' qualifications including sciences, computer science, history, geography and languages, and 3 other additional approved qualifications. Maths and English are also double weighted compared to other subjects.
To calculate the Attainment 8 score, each student's qualifying grades are converted to points and added up, with Maths and English double-weighted. The points values are given in the table below. Since 2017, reformed GCSEs have been graded on a 9-1 scale with each grade counting for the same number of points; the points values of the old unreformed A*-G grades changed from year to year as shown in the table.
| GCSE grade | 2016 points | 2017 and 2018 points |
|---|---|---|
| A* | 8 | 8.5 |
| A | 7 | 7.0 |
| B | 6 | 5.5 |
| C | 5 | 4.0 |
| D | 4 | 3.0 |
| E | 3 | 2.0 |
| F | 2 | 1.5 |
| G | 1 | 1.0 |
From the 2019 examination season onwards, all GCSEs have been graded on the 9-1 scale.
Note 3 - Proportion of students achieving Grade 4 or above in English and Maths
Until 2017, achieving GCSE grades A*- C in English and Mathematics was widely recognised as the minimum required to commence post-16 study such as A levels or vocational qualifications. Schools have also been ranked in performance tables by this ‘Basics’ measure.
From 2017, Grade 4 in the reformed GCSE examinations is regarded as a 'standard pass' and represents the minimum entry requirement for further education.
For selective schools like Langley Grammar School this figure ought to be very high; however, there will sometimes be a very small number of students in Year 11 who do not perform to this level due to illness or personal circumstances.
Note 4 - Proportion of students achieving Grade 5 or above in English and Maths
Grades 5 and above are regarded as 'strong passes'.
In 2017 schools are reporting the proportion of students gaining grade 4+ in English and Maths, and the proportion gaining Grade 5+ in those subjects. It is increasingly anticipated that Grade 5 will become the new 'expected' standard.
Note 5 - Proportion of students achieving the EBacc
The English Baccalaureate (‘E-Bacc’) is a school performance measure used by the Department for Education. It measures the proportion of students in Year 11 who gain GCSE grades A*-C in the following subjects:
* English
* Mathematics
* Two Sciences (Two from GCSE Computer Science, Biology, Chemistry or Physics, or GCSE Science and Additional Science)
* A language (modern languages, or ancient languages such as Latin)
* History or Geography
At Langley Grammar School students currently take GCSE courses in English, maths and three separate sciences as the core curriculum in Years 10 and 11. Although all Year 10 students are currently required to choose a modern foreign language, they may choose their remaining three options freely from a list which includes geography and history. Students are therefore currently not required by the school to study the full range of EBacc subjects although 80% or more choose to do so. The recent figures for the proportion of students achieving the EBacc essentially means that around three quarters of our students routinely choose to study History or Geography. This is in line with the Government's ambition for 75% of students to study an EBacc curriculum by 2022.
In 2015, the school's official EBacc figure was 1%. In this particular year, almost all students sat examinations in the three separate sciences - GCSE Biology, Chemistry and Physics. They achieved excellent results, averaging 75-80% A*/A grades across the three subjects. However, because these students had also taken GCSE Core Science in Year 10, they were deemed by the DfE to be on the Science + Additional Science pathway. None of their separate science results were therefore counted in the EBacc measure, despite most students having actually having four science qualifications. This clearly nonsensical situation arose as a result of the DfE changing the rules about what would count in the EBacc measure after the school had committed to entering the students for the Science examination.
Note 6 - Proportion of students continuing in education or training
This measures the number of students who either stayed in education or went into employment after Year 11. The data currently published on the DfE website is for students who finished Year 11 in 2017, which is the most recent data currently available.