
LangleyGrammar School

A Level outcomes
A Level results over time
The table below shows the A Level outcomes for Langley Grammar School students for the years when normal examinations were sat between 2018 and 2026.
|
Measure |
2018 Normal exams |
2019 Normal exams |
2023 First year of normal exams post-pandemic |
2024 |
2025 |
2026
|
|
A*-E grades |
99.1% |
99.4% |
98.6% |
99.5% |
99.8% |
99.8% |
|
A*-C grades |
89.5% |
87.5% |
89.8% |
96.0% |
96.5% |
94.0% |
|
A*-B grades |
71.2% |
67.3% |
76.4% |
85.5% |
85.6% |
82.3% |
|
A*/A grades |
35.6% |
36.7% |
53.0% |
59.9% |
60.3% |
53.2% |
|
A* grades |
9.8% |
8.5% |
20.6% |
27.0% |
22.5% |
20.0% |
What value do we add?
Gaining good grades at A Level is very important - the grades are the key to 'opening doors' in terms of accessing higher education courses. However, students completing A Level programmes have come from very different backgrounds in terms of their prior achievement at GCSE. Some students have almost all A* grades; others may have a consistent set of B grades across their subjects. What is important is the value we have added based on their starting points - how well have Langley Grammar School students done compared to others with similar academic backgrounds?
We measure the value added using a system called ALPS - A Level Performance System. Essentially this is a large database of A-Level results drawn from over 1500 schools and colleges and covering 75% of students taking A Levels. The ALPS system provides us with a number of indicators which can help us analyse how our students have performed.
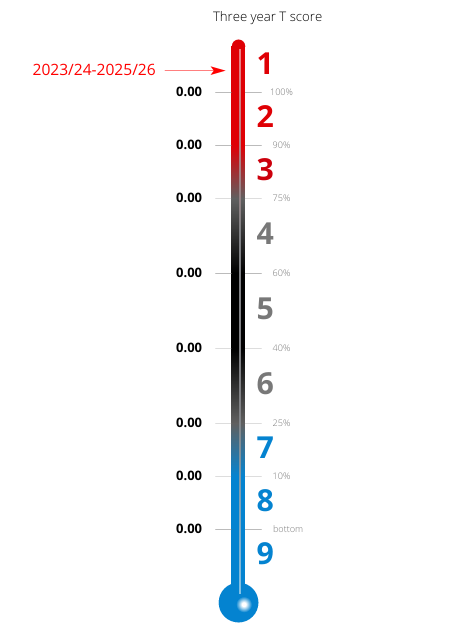
Each ALPS indicator has a benchmark 'thermometer'. The thermometer is created by taking scores achieved by every school and college and ranking these from best (top) to worst (bottom). The numbers running down the centre of the thermometers show the ALPS grades running from 1 (best) to 9 (worst).
An overall ALPS 'T Score' of grade 5 means students do no better or worse than they would do in any other school - they perform 'as expected' for their ability. For many years we have consistently secured ALPS grade 2 or 3 'Excellent', scoring between the 75th and 89th percentile.
Over the three-year period from 2024 to 2026, Langley Grammar School achieved a 'Three-Year ALPS score' of 1, placing the Sixth Form among the top few per cent of schools and colleges nationally for value added. This demonstrates that our students consistently make exceptional progress, achieving outcomes significantly above those expected from their already high academic starting points.
This success is the result of high-quality teaching, alongside the excellent guidance, care and support students receive throughout their time in the Sixth Form.
Statutory information
The Department for Education requires us to publish particular information regarding A Level outcomes. Please read the explanatory notes carefully.
| Average grade achieved | DfE measure of progress made | Retention | Progress in English and Maths | Students continuing in education or training | |
| See Note 1 | See Note 2 | See Note 3 | See Note 4 | See Note 5 | |
| 2022 | A (48.4 pts) | Not published | 96.0% | Not published | Not published |
| 2021 | Not published | Not published | Not published | Not published | 95% (2019 cohort) |
| 2020 | Not published | Not published | Not published | Not published | Not published |
| 2019 | B (38.8 pts) | +0.04 | 96.8% | None eligible | 92% (2017 cohort) |
| 2018 | B (38.8 pts) | +0.09 | 96.2% | None eligible | 93% (2016 cohort) |
| 2017 | B (40.2 pts) | +0.13 | 98.2% | None eligible | 92% (2015 cohort) |
| 2016 | B (38.7 pts) | +0.07 | 99.5% | None eligible | 92% (2014 cohort) |
Note 1 - Average grade achieved
These figures tell you the average grade and average points that students achieved per A level entry. Each grade has a points value to all qualifications based on the following equivalence:
A* = 60, A = 50, B = 40, C = 30, D = 20, E = 10
The information provided here is taken from the DfE Performance tables.
Note 2 - Progress
This figure tells you how much progress students made between the end of Key Stage 4 (Year 11) and the end of their A level studies, compared to students across England who gained similar GCSE results.
The scores are calculated by comparing the A-level results of students at this school or college with the A level results of students in schools and colleges across England who started with similar GCSE results at the end of Year 11.
A score above zero means students made more progress, on average, than students across England who got similar results at the end of Year 11. Langley Grammar School's Sixth Form students have well above average GCSE profiles, and go on to achieve A-Level grades which are above the average for those of other students of similar ability.
Comparative information about progress in Slough schools can be found through the following link:
Note 3 - Retention
As the participation age has been increased to 18, it is increasingly important that all young people are given suitable education and training opportunities that they see through to completion. The retention measure shows the percentage of students who get to the end of the post-16 programme of study that they enrolled on. Almost all Langley Grammar school students complete their two-year A-Level programme; where there are occasional exceptions, these are inevitably due to particular special circumstances.
Note 4 - Progress in English and maths
We are required to publish the progress of students in English and maths where they did not achieve at least a grade 4 at GCSE by the end of Year 11. The admissions criteria for entry into Langley Grammar School's Sixth Form require students to have achieved a GCSE grade 5 in both English and maths; students will therefore only fall into this category in exceptional circumstances. In 2019, all students in Year 13 at Langley Grammar School had achieved grade 4 or above in both English and maths at the end of Year 11.
Note 5 - Students continuing in education and training
Destination measures show the percentage of Sixth Form students going to or remaining in an education and/or employment destination after they leave the school. The Department for Education tracks students after they leave school through a variety of different data sets, but it takes some time for this data to be collated.
The most recent data reports on students in the 2015/16 academic year and identifies their education and/or employment destinations between October 2016 and March 2017. To be included in the measure, young people had to complete the first two terms of the academic year at one or more education destinations, or be in employment for 5 of the 6 months.
The great majority of Langley Grammar school students go on to higher education courses as reputable universities. A small number move into direct employment or higher level apprenticeships. Some students will take a gap year in order to reapply to university, and may spend that year travelling or working overseas - such activity would not be included in the measure.